A Guide to the Biology Lab Report Format
Struggling with the biology lab report format? This guide breaks down every section with practical examples to help you write a clear, effective report.
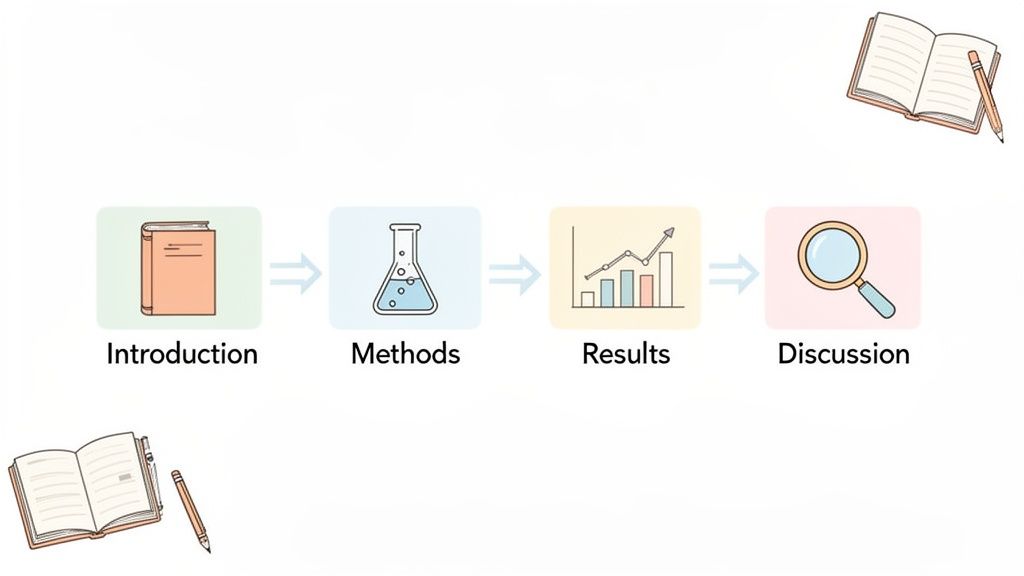
A proper biology lab report format is your roadmap for presenting scientific findings clearly and logically. At its core, it follows the IMRAD structure—that’s Introduction, Methods, Results, and Discussion. This isn't just a random set of rules; it's the gold standard for communicating experimental work everywhere, from your classroom to professional research labs.
Why Structure Is Your Secret Weapon in Science
I get it. Staring at a blank page, trying to fit your experiment into a rigid template, can feel like the hardest part of the assignment. But think of this structure less as a set of rules and more as a powerful tool for telling a scientific story. It’s a time-tested way to walk your reader through your work so they can understand it, critique it, and maybe even build on it.
Your report should take the reader on a logical journey.
- The Introduction sets the scene: Why did you do this experiment? What question are you trying to answer?
- The Methods section is your map. It needs to be so clear that someone else could follow your exact steps.
- The Results are the raw, unvarnished discoveries. Just the facts—what did you observe and measure?
- Finally, the Discussion is where you connect the dots. You get to interpret your results and explain what they mean in the bigger picture.
The Universal Language of IMRAD
This IMRAD structure isn't just for your biology class; it’s the universal language of science. Whether you're in high school or reading a groundbreaking paper in a professional journal, this format is what ensures everyone is on the same page. The skills you're building now by learning the biology lab report format are the same ones you'll use in university and any future STEM career.
This standardized approach is a big deal. Of the 1.7 million bachelor's degrees awarded in the U.S. in 2021–2022, a huge chunk were in biological sciences where IMRAD is non-negotiable. Top-tier institutions like Columbia University and local high schools alike publish detailed guides that all point back to this same fundamental structure. They're training students to think and write like professional scientists. To get a sense of how vital this format is, you can explore this detailed guide on report formatting.
Key Takeaway: Mastering the IMRAD structure is more than just a box to check for a good grade. It's a core skill that teaches you how to think, organize your findings, and communicate like a real scientist.
This guide will walk you through each component, piece by piece. My goal is to turn what feels like a daunting task into a series of manageable steps. Once you understand the why behind each section, you'll be able to write reports that are not just properly structured but genuinely compelling.
Diving Into Each Section of Your Report
Alright, let's break down the lab report section by section. Think of it like telling a story—a very precise, evidence-based story. Each part has a specific job to do, and getting them right is what separates a confusing report from a convincing one.
Before we get into the nitty-gritty, here’s a quick-glance table to keep you oriented. It's a lifesaver when you're staring at a blank page and wondering what goes where.
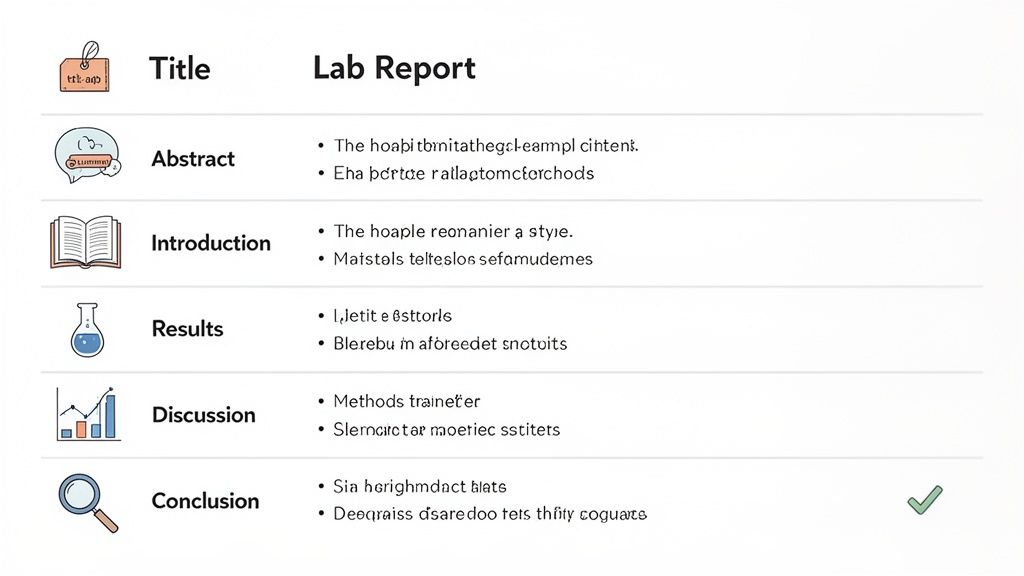
Anatomy of a Biology Lab Report
| Section | Core Purpose | What to Include |
|---|---|---|
| Title | To inform the reader of the experiment's topic at a glance. | The independent and dependent variables, the organism studied, and key context. |
| Abstract | To provide a complete, concise summary of the entire report. | A brief overview of the purpose, methods, key results, and major conclusion. |
| Introduction | To provide context and justify the reason for the experiment. | Background information, relevant existing research, study objectives, and your testable hypothesis. |
| Methods | To explain exactly how the experiment was conducted. | Detailed procedures, materials used, study organism, and any statistical analyses performed. |
| Results | To present the collected data objectively, without interpretation. | Text summaries of findings, labeled tables and figures (graphs, images), and statistical outcomes. |
| Discussion | To interpret the results and explain what they mean. | Analysis of findings, whether the hypothesis was supported, sources of error, limitations, and implications. |
| Conclusion | To provide a final, take-home message. | A concise summary of the experiment's main findings and their significance. |
| References | To credit the sources cited in the report. | A formatted list of all literature (journal articles, books, etc.) mentioned. |
| Appendices | To include supplementary material. | Raw data tables, detailed calculations, or extra figures that are not essential for the main report. |
This table is your roadmap. Now, let's explore what makes each of these sections effective.
The Title: Your First Impression
Your title needs to be more than just a label; it’s your headline. It should be specific enough that another scientist knows exactly what your experiment was about just by reading it.
A vague title like "Bean Plant Study" is a missed opportunity. A great title, on the other hand, packs in the key info. Try something like: "The Effect of Red vs. Blue Light Wavelengths on the Germination Rate of Phaseolus vulgaris." See the difference? It instantly tells the reader the variable tested, the outcome measured, and the organism involved.
The Abstract: The Whole Story in a Nutshell
The abstract is a powerhouse. It's a complete, miniature version of your entire report, usually capped at around 150-250 words. Even though it sits at the very beginning, you should always, always write it last.
Why? Because you can't summarize a story you haven't finished writing yet. A good abstract hits the four key points: the purpose of your study, a quick overview of your methods, your most important findings, and the main conclusion you drew from them.
The Introduction: Setting the Stage
Here’s where you answer the big "So what?" question. Your introduction needs to hook the reader by explaining the background science and making a case for why your experiment is important.
Start broad and then narrow your focus like a funnel. If you're studying how temperature impacts enzyme function, you’d begin with the general role of enzymes in cellular metabolism. Then, you'd bring in what's already known about temperature and enzymes, citing previous research. Finally, you funnel down to your specific, testable hypothesis.
A hypothesis isn't a question; it's a confident, predictive statement.
- Weak: "Will temperature change how enzymes work?"
- Strong: "Exposing catalase to temperatures above 40°C will lead to a significant decrease in its reaction rate due to protein denaturation."
Pro Tip: A killer introduction makes your experiment feel like the logical next step in a larger scientific conversation.
The Methods: Your Experimental Blueprint
The goal of the methods section is simple: replicability. Someone should be able to read your description and repeat your experiment exactly. This means you need to be painstakingly precise.
Write this section in the past tense and in a direct, no-frills style. You're not writing a cookbook with commands like "Heat the beaker." Instead, you're reporting what was done: "The beaker was heated to 60°C for 10 minutes."
Be sure to detail:
- The organism or system you studied.
- All materials and equipment used (include concentrations, brand names, or model numbers if they're important).
- The exact step-by-step procedure you followed.
- The statistical tests you used to analyze the data.
Remember, sound experimental procedure is grounded in safety. Following the best practices for lab safety and productivity is non-negotiable for protecting yourself and ensuring your data is reliable.
The Results: Just the Facts
This is where you present your findings—and only your findings. There’s no room for interpretation or explanation here; that comes later. Your job is to present the data clearly and objectively.
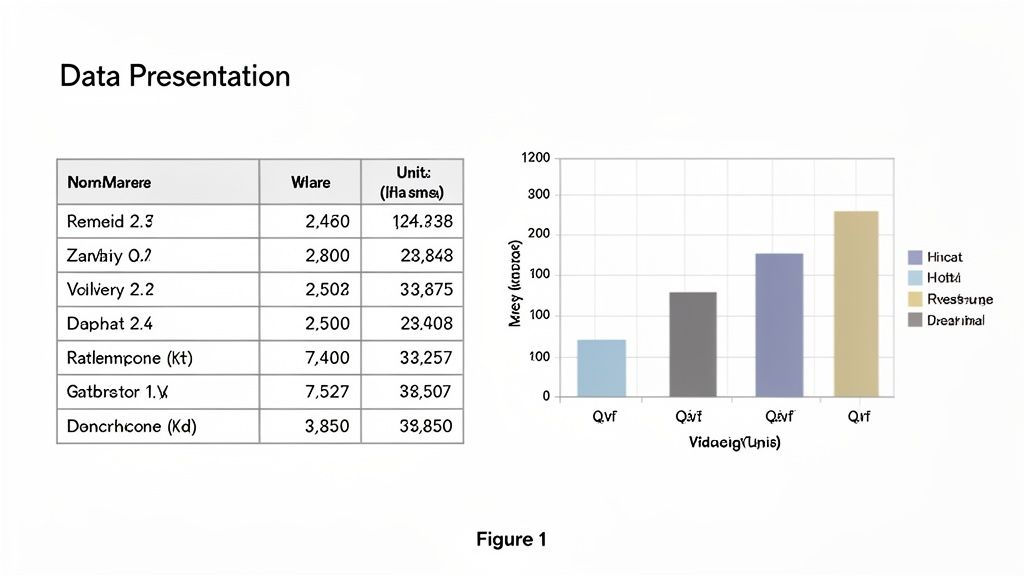
Use a mix of text, tables, and figures to show what you found. Start with a sentence that summarizes the overall trend, then point the reader to the visual evidence. For example: "As illustrated in Figure 1, plants grown under red light exhibited a greater average stem height than those grown under blue light (p < 0.05)."
Every table and figure needs a number (e.g., Table 1, Figure 1) and a descriptive title. A classic rookie mistake is to forget to label axes on graphs or include units of measurement—don't let that be you!
The Discussion and Conclusion: What It All Means
Now you get to interpret your data. The discussion is the heart of your report, where you connect your results back to the hypothesis from your introduction.
Start by stating whether your results supported your hypothesis. Then, dive into the why. What biological principles explain what you saw? This is also where you show you’re a critical thinker by addressing any limitations or potential sources of error. Was your sample size too small? Did a piece of equipment malfunction? Being honest about these things strengthens your report.
Finally, zoom back out and discuss the broader implications of your work. What does this mean for the field? What’s a logical next experiment? If you’re struggling to structure this section, mapping out your points first can be a huge help; check out these tips on https://feen.ai/blog/how-to-write-research-paper-outline for ideas.
Your report should end with a short, powerful conclusion. This is often just a final paragraph that summarizes the main takeaway of your experiment, leaving your reader with a clear sense of what was learned.
Mastering Scientific Style and Formatting
Beyond what you did in the lab, how you present it is what makes your report look credible and professional. This isn’t just about making things look pretty; it's about following scientific conventions that ensure anyone can pick up your work and understand it clearly. I’ve seen so many students lose easy points on simple technicalities, so getting a handle on the biology lab report format is a straightforward way to bump up your grade.
Trust me, the small details add up fast. A polished report signals to your professor that you took the assignment seriously and you understand the standards of scientific communication.
Adopting a Scientific Tone
Scientific writing has a very specific voice—it’s objective, clear, and to the point. The goal is to present your findings without any personal flair or flowery language.
One of the most important habits to get into is writing in the third-person passive voice, especially when you get to the Methods section. Instead of saying, "I added 10 mL of HCl to the solution," you’ll want to write, "Ten mL of HCl was added to the solution." This simple switch takes the focus off you and puts it where it belongs: on the experiment itself.
Another key rule is to always use the past tense. You're reporting on an experiment that’s already finished, so your verbs should reflect that. For instance, write "The data showed a correlation," not "The data shows a correlation."
Essential Formatting Rules
You'll find that formatting guidelines in science are remarkably consistent, whether you're in a freshman lab or reading a professional journal. Following them shows you get how things are done in the academic world. In fact, these rules are so important that about 15% of a typical lab report grade is often tied directly to getting the format and style right.
Here are the non-negotiables:
- Font: Stick to a standard, easy-to-read font like Times New Roman or Arial. Keep it at a 12-point size.
- Margins: Set your margins to 1 inch on all sides of the page. No more, no less.
- Spacing: The entire document should be double-spaced. Yes, that includes the references section. It gives your instructor room to breathe (and leave comments).
These conventions are so universal that they’re baked into academic expectations. For example, if you look at the guidelines from Fort Lewis College’s Biology Department, you’ll see they require 11–12 pt Arial or Times New Roman with 1-inch margins, typed and divided into sections. This isn't some random rule; it's a widespread standard that, if you follow it, helps you avoid losing points on things that are easy to get right. You can see for yourself how these formatting standards are applied in college biology programs.
Key Takeaway: Consistent formatting isn’t just a suggestion. Following these simple rules for font, margins, and spacing is a crucial part of creating a professional scientific report and an easy way to protect your grade.
Citing Your Sources Correctly
Anytime you bring in information that isn't your own original thought—whether it's background theory for your introduction or a study you’re comparing your results to—you absolutely must cite it. Not doing so is plagiarism, which is a huge deal in academia.
In biology, you'll typically run into a couple of specific citation styles. The most common are APA (American Psychological Association) and CSE (Council of Science Editors). Your professor will almost always tell you which one to use. The most important thing is to be consistent; pick a style and stick with it for the entire report.
Every source you cite will appear in two places:
- In-text citations: A short reference right inside your paragraph, like (Smith, 2021).
- Literature Cited section: A complete, alphabetized list of all your sources at the very end of the report, formatted perfectly.
For example, an APA in-text citation might look like this: "The enzyme activity decreased at higher temperatures (Johnson & Lee, 2020)." That source would then have a full entry in your Literature Cited section with all the publication details. Getting the hang of citations takes practice, but it's a fundamental skill you'll use for the rest of your academic career. And while APA and CSE are the go-to's in science, it's good to know how other styles work—our guide on how to cite sources in MLA is a good place to see how different formats are structured.
Presenting Your Data with Impact
This is where your hard work in the lab pays off. The Results section is the core of your report, showcasing all the evidence you’ve collected. But a jumble of raw numbers isn't going to cut it. Your job here isn’t just to dump data; it’s to present it so clearly that your findings are obvious at a glance.
This is where visual elements in your biology lab report format become so important. A sharp graph or a clean table can tell a story far more powerfully than a dense paragraph ever could. How you choose to show your data will shape your reader's understanding, so it's a decision that deserves some thought.
Tables vs. Figures: What’s the Right Call?
One of the first decisions you'll make is whether to use a table or a figure (like a bar graph or line chart). There isn't a single rule, but the guiding principle is simple: pick the format that tells your story most effectively.
- Use a table when you need to display precise, individual numbers. They’re perfect for organizing a large amount of raw data, like the exact measurements from every single trial you ran.
- Use a figure when you want to highlight a trend, pattern, or relationship. Bar graphs are fantastic for comparing different groups, while line graphs are the go-to for showing how something changes over time.
Think of it this way: if you measured the exact height of 20 plants across five different light treatments, a table is the best way to list every single one of those measurements. But if you want to quickly show which treatment produced the tallest plants on average, a bar graph is your best friend.
Designing for Maximum Clarity
After picking your format, you need to design it for readability. A cluttered, confusing visual is honestly worse than no visual at all. The goal is always simplicity, making sure your reader can grasp the main takeaway in just a few seconds.
A few tips I've learned over the years:
- Keep it clean. Resist the urge to use flashy colors, 3D effects, or busy gridlines. Let your data be the star.
- Label everything. Every axis needs a clear label stating the variable and its unit of measurement (e.g., "Time (minutes)" or "Concentration (mg/L)").
- Be consistent. Stick to the same symbols, colors, and abbreviations throughout your report. This avoids any potential confusion.
A great tool for visualizing data distribution is a box and whisker plot maker. It helps create those standardized plots that are a staple in scientific reporting, giving a clear picture of your data's spread.
Crafting Titles and Captions
Every single table and figure needs to be numbered in sequence (Table 1, Figure 1, Figure 2) and paired with a descriptive title or caption. This is a non-negotiable part of the format, and frankly, it's where a lot of students lose easy points.
The conventions are a little different for each:
- Table Titles: These always go above the table. It should be a single, clear sentence describing what the table contains. For example: "Table 1. The effect of varying pH levels on the rate of amylase activity."
- Figure Captions: These always go below the figure. A good caption explains what the figure shows, gives some context, and often includes key results or statistical info. For example: "Figure 1. Average plant height after 14 days of growth under different light conditions. Error bars represent the standard deviation of the mean (n=10)."
Pro Tip: When you mention a figure or table in your text, refer to it directly. Write, "Plants grown under red light were significantly taller (Figure 1)," not "The graph below shows..." It's more direct and sounds much more professional.
Weaving in Your Statistical Analysis
Modern biology reports are built on quantitative proof. This means statistics aren't an afterthought; they need to be integrated directly into how you present your data. Your grading rubric likely gives a huge chunk of points—often 20-30%—to the Results and Discussion, and this is where that statistical proof shines.
You'll always want to include descriptive statistics like the mean (average) and standard deviation. The mean gives your central value, and the standard deviation tells the story of how spread out your data points are. If you need a refresher on this, our guide on how to calculate standard deviation can help.
When you perform inferential tests (like a t-test), you have to report the results correctly. The standard format includes the name of the test, the p-value, and your sample size or degrees of freedom. This shows your instructor that your conclusions aren't just guesses—they're backed by solid analytical work.
A Final Checklist Before You Submit
You’ve made it. The experiment is done, the data is crunched, and the words are on the page. Before you fire off that email or click "submit," take a moment for one last, crucial step. A final, systematic check can easily be the difference between a B+ and an A.
Think of it as your pre-flight inspection. After staring at the same document for hours, it’s incredibly easy to miss small errors. This checklist is designed to help you catch those little things that can cost you big points.
Overall Formatting and Style
Let’s start with the bird's-eye view. These are the visual and stylistic elements that shape your report's first impression. Nailing them shows you respect the conventions of scientific writing.
- Font and Spacing: Is everything in a standard font like 12-point Times New Roman? Is the entire document consistently double-spaced? Check everywhere—even the reference list!
- Margins and Pages: Are your margins a clean 1 inch on all sides? Did you remember to add page numbers?
- Voice and Tense: Have you stuck to an objective, third-person voice throughout? Your Methods and Results should be in the past tense because you're describing what you already did.
- Citations: Double-check that every single in-text citation (e.g., (Smith, 2021)) has a matching entry in your References section. And vice-versa!
A Quick Tip from Experience: I once lost nearly a full letter grade because my References list was single-spaced. It felt like such a small oversight, but my TA saw it as a lack of attention to detail. Don't let easy points like that slip away.
Section-by-Section Content Review
Alright, now it’s time to get granular. Go through your report one section at a time to make sure your scientific story is clear, logical, and complete.
Title and Abstract
- Does your Title actually describe the experiment? It should clearly mention the key variables and the organism you studied.
- Is your Abstract a tight summary (usually under 250 words)? It needs the purpose, a hint of the methods, the main results, and the conclusion. Remember, you should always write this part last.
Introduction
- Have you given enough background for someone to understand why you did this experiment?
- Is your hypothesis clear, testable, and written as a predictive statement? It should never be a question.
Methods
- Could another student in your class pick up this section and repeat your experiment exactly? If not, you need more detail.
- Be sure to list all significant materials, the step-by-step process, and any statistical tests you ran.
Results
- Did you stick to the facts? This section is for presenting data without any interpretation or explanation. Just the "what," not the "why."
- Are all your tables and figures numbered sequentially? Check that titles go above tables and captions go below figures.
- Look at your graphs one last time. Are all axes labeled with both the variable and the units of measurement?
Discussion and Conclusion
- Did you circle back and explicitly state whether your results supported or refuted your hypothesis?
- Have you explained what your results mean using biological concepts from your class or textbook?
- Did you own up to any potential sources of error or limitations? Every experiment has them.
- Does your Conclusion wrap everything up with a clear, final take-home message?
Pre-Submission Checklist
Before you officially turn it in, run through this quick table. It’s a simple way to give yourself peace of mind that you haven't missed a single requirement.
| Check Point | Status (Yes/No) |
|---|---|
| Title: Clearly states variables and organism | |
| Abstract: Under word limit and summarizes all key sections | |
| Introduction: Provides context and a clear hypothesis | |
| Methods: Detailed enough for replication | |
| Results: Data presented objectively, figures/tables formatted correctly | |
| Discussion: Interprets results and addresses hypothesis | |
| Conclusion: Summarizes the main findings | |
| References: All sources cited correctly in-text and in the list | |
| Formatting: 12pt font, double-spaced, 1-inch margins | |
| Proofreading: Checked for spelling and grammar errors |
Going through this process solidifies all your hard work. You’re not just handing in an assignment; you're presenting a piece of scientific communication that is ready for scrutiny. Now, you can submit it with confidence.
Got Questions? We've Got Answers
Even with the best template in hand, you're bound to hit a few snags while you're in the thick of writing. Let's tackle some of the most common questions that trip students up when they're putting together a biology lab report. This is your go-to for those little "wait, what do I do here?" moments.
Results vs. Discussion: What’s the Real Difference?
This is, without a doubt, the number one point of confusion. The easiest way I've found to remember it is this: Results is what you found. Discussion is what it all means.
- Your Results section is strictly for the facts. It's where you present your data objectively, using text, tables, and figures. There should be zero interpretation happening here. Think of it like a news report: "The average plant height in the experimental group was 15.2 cm, while the control group averaged 10.8 cm (Figure 1)." That's it.
- The Discussion is where you bring those facts to life. Here, you get to analyze the data. You’d interpret that height difference, dig into the biological reasons why it might have happened, and tie everything back to the hypothesis you started with.
Pro Tip: If you find yourself typing words like "because," "suggests," or "indicates," you've probably wandered out of the Results section and into the Discussion. Keep them separate!
How Much Detail is Too Much for the Methods Section?
The golden rule for your Methods section is replicability. Could another biology student read your description, walk into a lab, and repeat your experiment exactly?
This is a balancing act. You don't need to explain how to pipette or turn on a microscope—those are standard skills. But you absolutely must include the critical details that could change the outcome.
Be sure to list specifics like:
- Precise amounts and concentrations (e.g., "5 mL of a 0.5M sucrose solution").
- Exact timings and temperatures (e.g., "incubated at 37°C for 20 minutes").
- The make and model of any special equipment if it's not standard lab issue.
Think of it less like a story and more like a very precise recipe for a scientific procedure.
Is It Okay to Use "I" or "We" in a Lab Report?
This is a classic question. The old-school, traditional approach to scientific writing is to avoid the first person ("I," "we") to sound more objective. This is why you see the passive voice so often, especially in Methods (e.g., "The solution was heated" instead of "We heated the solution").
However, times are changing. Many instructors and even some scientific journals now prefer the active voice because it's clearer and more direct ("We observed that..."). So what should you do? Always check your instructor's or TA's specific guidelines. They have the final say. If you can't find a clear rule, sticking with the formal, third-person passive voice is always the safest bet.
What if My Results Completely Contradict My Hypothesis?
Congratulations! From a scientific standpoint, that's actually a great result. Science isn't about being "right." It's about a process of honest discovery. Unexpected or "negative" results are often the most valuable because they challenge our assumptions and spark new investigations.
If your data doesn't support your hypothesis, your job in the Discussion section is straightforward:
- First, state clearly that your findings did not align with your initial hypothesis.
- Then, brainstorm potential reasons why. Was there a subtle flaw in the experimental setup? Could an uncontrolled variable have influenced the outcome? Or, most interestingly, is the biology behind it all more complex than you first assumed?
Whatever you do, never, ever massage your data to fit your hypothesis. Scientific integrity is everything. A thoughtful, honest analysis of why things went unexpectedly will always earn you more respect (and a better grade) than fudged results.
Still wrestling with a tricky concept or not sure how to frame your discussion? Feen AI can be a great study partner. It's designed to help you work through tough homework questions, sanity-check your reasoning, and get ideas for structuring your writing. Just upload your notes or type in a question to get some clear, step-by-step guidance. Give Feen AI a try and make your next report easier.
Recent articles

What is the difference between mitosis and meiosis? This guide provides a clear comparison of purpose, stages, and outcomes for students and curious minds.

What is the difference between speed and velocity? what is the difference between speed and velocity explained in plain terms with helpful examples.

Learn how to solve inequalities step by step. This guide covers linear, absolute value, and quadratic inequalities with clear examples and real-world tips.

Struggling with homework? This guide shows you how to convert units in chemistry with dimensional analysis. Master moles, grams, concentration, and more.

Struggling with 'what is conservation of energy'? This guide breaks down the core law with simple analogies, worked examples, and real-world applications.

Discover what is dimensional analysis in chemistry and master the factor-label method with clear, step-by-step examples.