How to Calculate Standard Deviation A Practical Guide
Learn how to calculate standard deviation with clear, real-world examples. This guide breaks down the formulas for population and sample data step by step.
So, you want to calculate standard deviation. At its core, it's just the square root of the variance. You'll start by finding the mean of your data, then see how far each data point deviates from that mean, square those deviations, average them out, and finally, take the square root. Simple enough, right?
But before we get lost in the formulas, let's get a real feel for what standard deviation actually tells us.
What Standard Deviation Actually Tells You
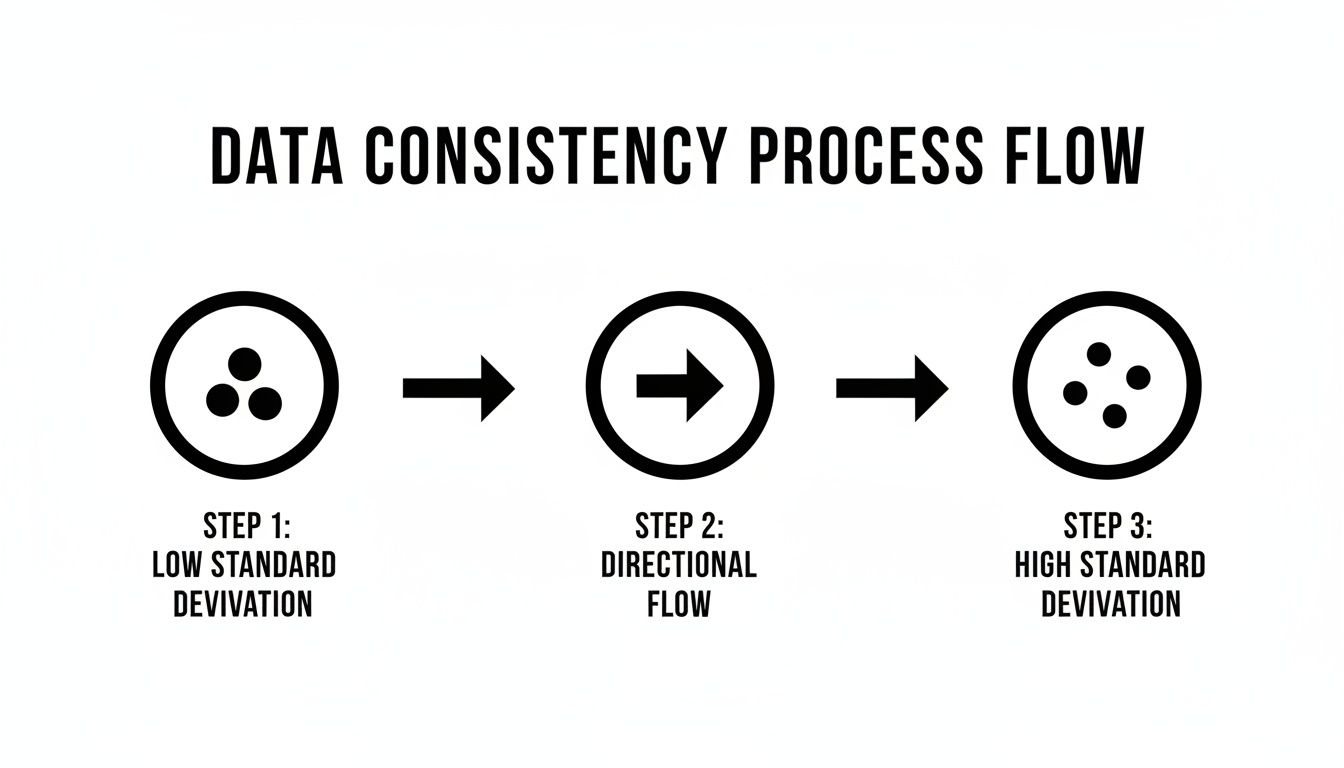
Think of standard deviation as a consistency score for your data. A low score is a good sign—it means your data points are all huddled together, close to the average. A high score, on the other hand, tells you the data is scattered all over the place. Essentially, it measures the typical distance between any given data point and the mean.
Grasping this concept is key because it adds a whole new layer of meaning to a simple average.
Visualizing Data Spread
Let's imagine two basketball players. On paper, they look identical because both average 20 points per game. But standard deviation pulls back the curtain to reveal their true nature:
- Player A has a low standard deviation of just 2 points. This player is a rock of consistency. Night after night, you can bet they'll score somewhere between 18 and 22 points. You know exactly what you're getting.
- Player B comes with a high standard deviation of 15 points. This player is a total wildcard. They could explode for 40 points one night and then completely disappear with only 5 points the next.
This same logic holds true everywhere. In a classroom, a low standard deviation on a test means most students performed at a similar level. For a factory producing widgets, a low standard deviation for product weight signals excellent quality control.
Key Takeaway: Standard deviation isn't just some abstract number spit out by a calculator. It’s a practical, real-world measure of consistency and predictability. It tells you how much you can trust the mean to represent the whole dataset.
Why This Matters in the Real World
This idea of measuring data spread isn't new. The term 'standard deviation' was first coined by the mathematician Karl Pearson way back in 1893. He built on earlier work from fields like astronomy, where scientists were trying to account for measurement errors. Pearson's work gave us a formal, standardized way to quantify variation, and it's been an indispensable tool ever since.
Today, you'll find it used everywhere. In the financial world, standard deviation is a direct measure of an investment's risk. A stock with a high standard deviation is seen as volatile because its price can swing wildly. To really understand how this works, you need to delve deeper into market volatility and see how it shapes investment strategies.
Scientists also rely on it heavily to check if their experiment results are statistically significant. At the end of the day, learning how to calculate standard deviation gives you a powerful new lens to see the world. You can move beyond simple averages and start to understand the variability and consistency that defines nearly any set of data you'll ever encounter.
Calculating Population Standard Deviation By Hand
When you have data for an entire group—the whole population—you can calculate its exact standard deviation. This isn't an estimate; it's a precise measure of how spread out the data points are. Think of situations where you have a complete dataset, like the final exam scores for every student in one specific class, or maybe the weights of all products that came off an assembly line in a single hour.
Let's walk through an example to see how it's done. Imagine a small, local chess club with just five members. Our "population" here isn't every chess player in the world, but only these five specific people.
Our Chess Club Example
The ages of the five members are:
- Member 1: 22
- Member 2: 26
- Member 3: 30
- Member 4: 34
- Member 5: 38
The very first thing we need is a central point to measure from. In statistics, that's almost always the mean, or average. We'll represent the population mean with the Greek letter mu (μ).
First, Find the Mean
To get the mean, you just add up all the ages and divide by the number of members (N), which is 5.
(22 + 26 + 30 + 34 + 38) / 5 = 150 / 5 = 30
So, the average age of our chess club members is 30 years old. This number is the anchor for the rest of our calculation.
As this visual shows, a low standard deviation means the data is tightly clustered and consistent. A high standard deviation means it's spread out and more variable. Our goal is to put a number to that spread for our chess club's ages.
Next, Calculate the Variance
Now we need to figure out how far each person's age is from our mean of 30. We do this by subtracting the mean from each age, squaring the result to make sure we're only dealing with positive numbers, and then finding the average of those squared differences. This gives us a value called the variance (σ²).
Let's do it for each member:
- (22 - 30)² = (-8)² = 64
- (26 - 30)² = (-4)² = 16
- (30 - 30)² = (0)² = 0
- (34 - 30)² = (4)² = 16
- (38 - 30)² = (8)² = 64
Now, we add up all those squared differences: 64 + 16 + 0 + 16 + 64 = 160.
To get the variance, we find the average of that sum by dividing by N (our 5 members): 160 / 5 = 32.
The variance (σ²) for our chess club's ages is 32. This number is a bit abstract—it represents the average squared distance from the mean. To make it more intuitive, we have one final step.
Finally, Find the Standard Deviation
This last part is simple. The standard deviation (σ) is just the square root of the variance. Taking the square root gets us back to our original units (years) and gives us a much more interpretable number.
σ = √32 ≈ 5.66 years
And there we have it. The standard deviation is about 5.66 years. This means that, on average, a typical member of this chess club is about 5.66 years older or younger than the mean age of 30.
This manual process—finding the mean, squaring the differences, averaging them, and taking the square root—is the core logic behind the calculation. For a closer look at the thinking behind these kinds of multi-step calculations, our guide on how to solve math problems step-by-step can be a big help.
This method works for any complete population dataset. For example, if you had a small dataset like {2, 4, 4, 4, 5, 5, 7, 9}, you'd find the mean is 5, and the population standard deviation (σ) is exactly √(32/8), which equals 2.
Calculating Sample Standard Deviation By Hand
Let’s be realistic. Most of the time, you won't have access to data for an entire population. It’s usually completely impractical—or downright impossible—to survey every person or test every single product. That’s why we work with a sample: a smaller, more manageable group that gives us a snapshot of the larger whole.
This is where the sample standard deviation comes in, and it's calculated just a bit differently.
Imagine a large university wants to get a handle on the height variation across its entire student body. Measuring tens of thousands of students is a non-starter. Instead, they can take a random sample of just 10 students to get a solid estimate.
Our Sample Student Heights
Here are the heights we collected from our 10-student sample, measured in inches:
- 68, 71, 66, 74, 69, 70, 72, 67, 73, 70
Just as we did with the population data, our first job is to find the mean. For a sample, we represent the mean as x̄ (pronounced "x-bar").
- (68 + 71 + 66 + 74 + 69 + 70 + 72 + 67 + 73 + 70) / 10 = 700 / 10 = 70 inches
So, the average height in our small group is 70 inches. Now we're ready to figure out the spread around that average.
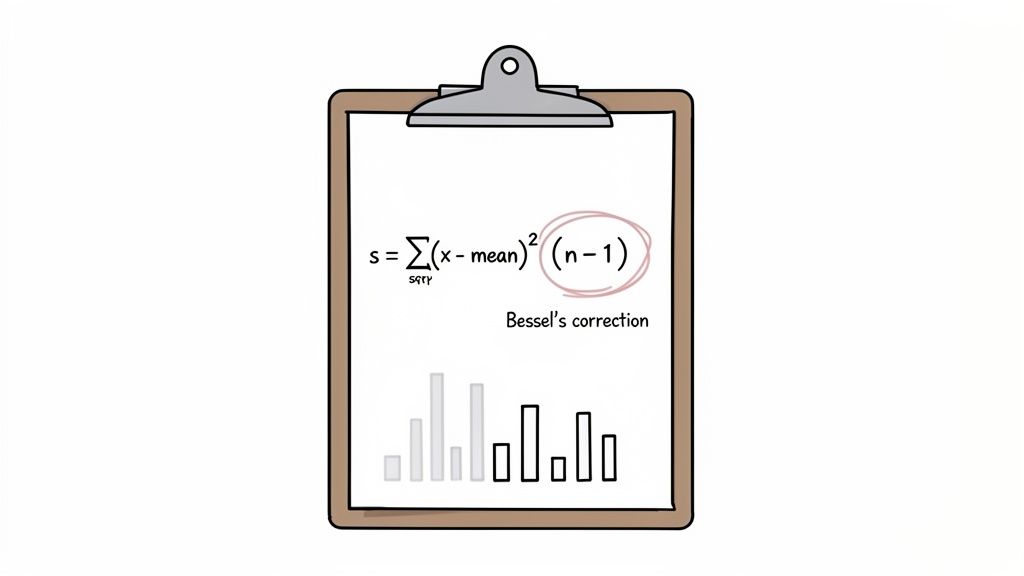
Unpacking the "n-1" Correction
This is where the calculation for a sample takes a crucial turn. When finding the sample variance, we don't divide by the total number of data points (n). We divide by n-1.
This isn't just a random statistical quirk; it's a vital adjustment called Bessel's correction. Think about it: a small sample is less likely to capture the true outliers—the extremely tall or short students in the full population. Because of this, a sample's variance naturally tends to be a little smaller than the actual population variance.
By dividing by a slightly smaller number (n-1 instead of n), we intentionally inflate the variance just a bit. This clever tweak compensates for the missing extremes and gives us a much more accurate, unbiased estimate of the entire population's spread.
Calculating the Sample Variance and Standard Deviation
Keeping that correction in mind, let's work through the numbers. We’ll find the squared differences from our sample mean of 70, add them up, and then apply Bessel's correction.
- (68-70)² = 4
- (71-70)² = 1
- (66-70)² = 16
- (74-70)² = 16
- (69-70)² = 1
- (70-70)² = 0
- (72-70)² = 4
- (67-70)² = 9
- (73-70)² = 9
- (70-70)² = 0
The sum of these squared differences comes out to: 4 + 1 + 16 + 16 + 1 + 0 + 4 + 9 + 9 + 0 = 60.
Now, it’s time to find the sample variance (s²). We divide our sum by n-1 (which is 10-1 = 9).
s² = 60 / 9 ≈ 6.67
The final step is getting the sample standard deviation (s) by taking the square root of the variance.
s = √6.67 ≈ 2.58 inches
So, what does this tell us? On average, a student's height in our sample strays from the mean of 70 inches by about 2.58 inches. And thanks to Bessel's correction, this isn't just a fact about our 10 students; it's our single best estimate for the standard deviation of all students at the university.
Making Sense of Your Standard Deviation Value
Okay, so you've crunched the numbers and calculated the standard deviation. Now what? You're staring at a single number, but the real magic is in understanding what that number is telling you about your data.
At its core, standard deviation is a measure of spread. Think of it as a single number that summarizes how consistent or how scattered your data is. A low standard deviation means your data points are all huddled together, close to the average. On the other hand, a high standard deviation indicates that the values are all over the place, spread far and wide from the mean.
A Quick Shortcut: The Empirical Rule
For data that's roughly bell-shaped (what statisticians call a normal distribution), there’s a fantastic rule of thumb called the Empirical Rule. It's also known as the 68-95-99.7 rule, and it gives you an instant feel for your data's structure.
Here's how it breaks down:
- About 68% of your data will fall within one standard deviation of the mean.
- Roughly 95% of your data will be within two standard deviations.
- Nearly all of it—99.7%—will lie within three standard deviations.
This visual really helps bring the concept to life, showing how the standard deviation carves out these predictable zones in a normal distribution.
So, let's make this real. Imagine the average score on a final exam was a 75, and you calculated a standard deviation of 5. Using the Empirical Rule, you'd know that about 68% of the class scored somewhere between a 70 (75 - 5) and an 80 (75 + 5). Suddenly, that number '5' isn't just a number; it's a story about the class's performance.
Context Is Everything
This is probably the most important takeaway: whether a standard deviation is "high" or "low" is completely dependent on the context. There's no one-size-fits-all answer.
Key Insight: A "good" or "bad" standard deviation is meaningless without context. The goal is to understand what that variability implies for your specific situation, whether you're aiming for consistency or assessing risk.
Consider how differently we'd interpret it in two fields:
- Finance: If you're looking at stocks, a high standard deviation screams volatility and risk. The price is swinging wildly, which could mean big gains or, just as easily, big losses.
- Manufacturing: Now imagine a factory producing smartphone screens. Here, a low standard deviation in screen thickness is the holy grail. It means every single screen coming off the line is virtually identical—a sign of exceptional quality control.
The idea of using standard deviation to make these kinds of judgments was pushed forward by the statistician Ronald Fisher in the early 1900s. He helped develop its role in hypothesis testing, giving us the tools to draw reliable conclusions from smaller data samples. This leap turned a simple calculation into a powerful way to gain insights in everything from agriculture to medicine. If you're curious about where this leads, our guide on what is hypothesis testing in statistics is a great next step. For more on the background, you can also learn about the fascinating history of standard deviation's application.
Using Common Tools to Find Standard Deviation Fast
While working through the standard deviation formula by hand is a fantastic way to grasp what's really happening under the hood, it’s not something you'll do for large datasets. In any practical setting, from a business report to a scientific study, you need speed and precision. That's where software comes in.
Thankfully, the programs you probably use every day have built-in functions that handle all the complex calculations for you in an instant. This lets you skip the tedious math and jump straight to interpreting what your data is telling you.
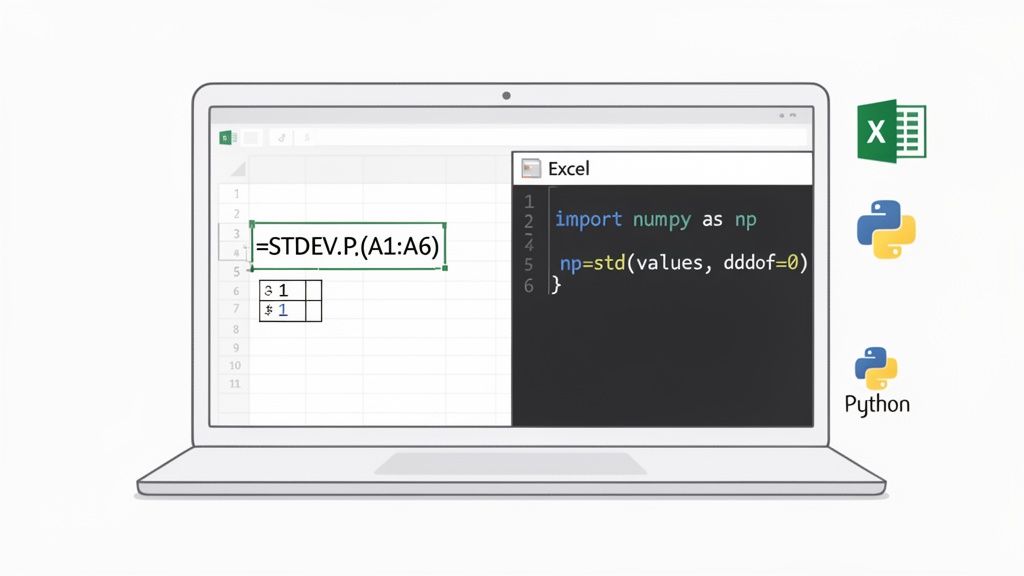
Get Standard Deviation in Excel and Google Sheets
For many of us, spreadsheets are the first stop for number crunching. Both Microsoft Excel and Google Sheets make finding standard deviation incredibly easy, and they use almost identical commands.
The most important part is picking the right function for your data:
=STDEV.P(range): Use this when you have data for the entire population. Think of the "P" as standing for population.=STDEV.S(range): Choose this when your data is a sample of a larger group. The "S" here stands for sample.
Imagine you've listed 10 test scores in cells A2 through A11. If those 10 students are the entire class you're studying (the population), you'd type =STDEV.P(A2:A11) into an empty cell and press Enter.
But if those 10 students were just a random handful from a whole school district, they'd be a sample. In that case, you'd use =STDEV.S(A2:A11) to get the correct estimate for the larger group.
Pro Tip: Don't worry if your data range includes text or empty cells. Both Google Sheets and newer versions of Excel are smart enough to ignore them automatically when calculating the standard deviation.
Commands for Data Analysis Software
When you start working with bigger and more complicated datasets, you'll likely turn to more powerful tools like R or Python. These platforms are the bread and butter of data scientists and researchers, and they also have straightforward commands for these calculations. The syntax might look a bit different, but the core concept is the same.
In Python, the go-to library for numerical work is NumPy:
numpy.std(your_data): This command calculates the population standard deviation by default.numpy.std(your_data, ddof=1): To get the sample standard deviation, you add the argumentddof=1. This little piece of code applies Bessel's correction (the n-1 denominator).
For statisticians and academics using the R programming language, the function is just as direct:
sd(your_data): The standardsd()function in R is built to calculate the sample standard deviation right out of the box.- To find the population standard deviation, you have to do a small manual adjustment, usually by multiplying the sample result by
sqrt((n-1)/n).
To make things easier, here’s a quick-reference table.
Standard Deviation Commands for Different Tools
| Tool | Population SD Function | Sample SD Function |
|---|---|---|
| Excel / Google Sheets | =STDEV.P(range) |
=STDEV.S(range) |
| Python (NumPy) | numpy.std(data) |
numpy.std(data, ddof=1) |
| R | Requires custom formula | sd(data) |
Mastering these simple commands is a huge time-saver and a fundamental skill for anyone working with data. If you ever find yourself stuck on more advanced statistical problems, an AI math solver can be a great resource for getting detailed, step-by-step guidance.
Frequently Asked Questions About Standard Deviation
Once you start calculating standard deviation, a few questions almost always come up. It's completely normal—these are the concepts that often trip people up at first. Let's tackle them head-on so you can feel confident in not just how to find the number, but what it actually means.
Getting these details right is what separates someone who can plug numbers into a formula from someone who truly understands their data.
Can Standard Deviation Be Negative?
This is a great question, and the answer is simple: no, standard deviation can never be negative.
The reason lies in the math itself. Remember how one of the key steps is to square the differences between each data point and the mean? Well, squaring any number—positive or negative—always gives you a positive result. For instance, (-5)² is 25, and so is 5².
Since the standard deviation is the square root of the average of all those positive squared numbers, the final result has to be positive, too.
The lowest possible value for standard deviation is zero. This only happens in one specific case: when every single number in your dataset is exactly the same. If all the values are identical, there’s no spread, no variation, and thus, a standard deviation of 0.
Is a High or Low Standard Deviation Better?
This is the classic "it depends" scenario. There’s no universal "good" or "bad" standard deviation because its value is only meaningful within the context of your data and what you're trying to achieve.
Let’s look at a couple of real-world examples to see what I mean:
- In Manufacturing: Imagine a factory making engine pistons. The manager would want an extremely low standard deviation for the piston diameters. Here, low variability means high precision and consistent quality. Every part fits perfectly.
- In Investing: A venture capitalist searching for the next big thing might actually look for stocks with a high standard deviation. High variability signals high volatility—which means more risk, but also the potential for much higher returns.
The key isn't the number itself, but what it tells you. A low standard deviation means the data points are clustered together—it signals consistency and predictability. A high one means the data is spread out, pointing to variability and, often, risk.
Why Do We Square the Deviations?
It’s a fair question. Why go through the trouble of squaring the differences from the mean? Why not just average their absolute values? There are a couple of important reasons, one practical and one more mathematical.
First, if you just added up the raw deviations from the mean (the positive and negative differences), they would always cancel each other out and sum to zero. That doesn't help us measure spread at all. Squaring is a neat trick to make all those differences positive before we average them.
But more importantly, squaring gives greater weight to outliers. A data point that is far from the mean has a much bigger impact on the final standard deviation than a point that's close. This makes the standard deviation a very sensitive measure of dispersion, which is exactly what statisticians need for more advanced work.
Nailing down these details is a huge step toward mastering statistics. If you need more homework help breaking down concepts like this, check out Feen AI. You can ask questions in plain English and get clear, step-by-step explanations on any topic, from stats to chemistry. You can learn more by visiting the Feen.ai website.
Recent articles

What is the difference between mitosis and meiosis? This guide provides a clear comparison of purpose, stages, and outcomes for students and curious minds.

What is the difference between speed and velocity? what is the difference between speed and velocity explained in plain terms with helpful examples.

Learn how to solve inequalities step by step. This guide covers linear, absolute value, and quadratic inequalities with clear examples and real-world tips.

Struggling with homework? This guide shows you how to convert units in chemistry with dimensional analysis. Master moles, grams, concentration, and more.

Struggling with 'what is conservation of energy'? This guide breaks down the core law with simple analogies, worked examples, and real-world applications.

Discover what is dimensional analysis in chemistry and master the factor-label method with clear, step-by-step examples.