How to Find Slope Intercept Form From Any Starting Point
Learn how to find slope intercept form (y=mx+b) from two points, an equation, or a graph. Our guide simplifies the process with clear, practical examples.

Finding the slope-intercept form of a linear equation always comes down to one goal: getting it into that clean y = mx + b format. It doesn't matter what you're starting with—another type of equation, a couple of points, or a line on a graph. The mission is always to get y by itself on one side, which instantly shows you the line's slope (m) and where it crosses the y-axis (b).
The Language of Lines: What y = mx + b Really Means
Before diving into the "how," let's get a feel for the y = mx + b equation itself. Don't think of it as just a formula to memorize; it’s more like a universal language for describing any straight line. Every single piece of it tells you something important.
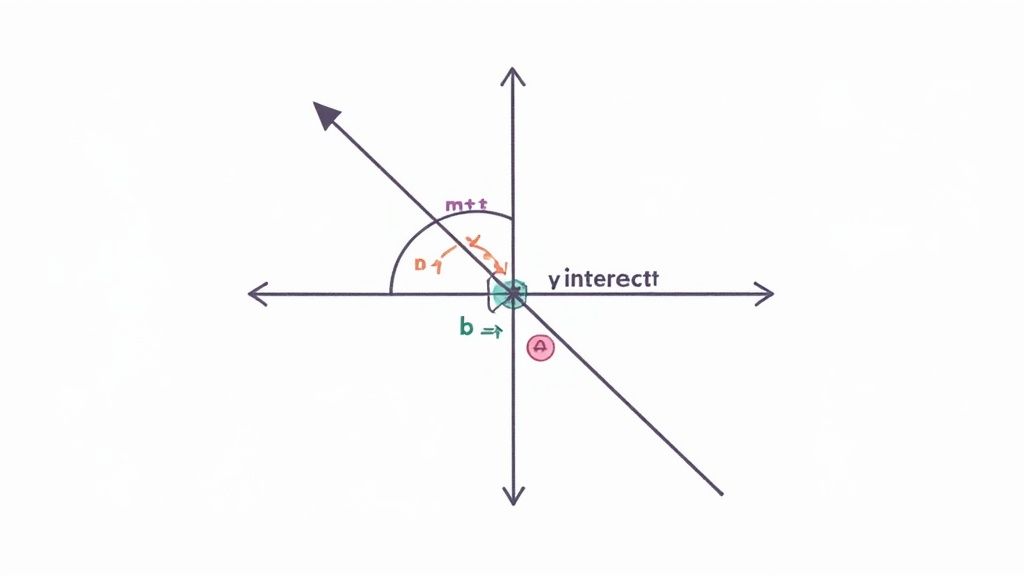
- 'm' is the Slope: This number tells you how steep the line is and which way it's headed. A positive slope means the line travels "uphill" as you read from left to right. Think of it like a plane taking off. A negative slope means it's going "downhill," like a skier heading down a mountain.
- 'b' is the Y-Intercept: This is simply the line's starting point on the vertical y-axis. It's the exact spot where the line crosses that axis. If you start a race 50 meters ahead of the starting line, that +50 is your y-intercept.
There's a good reason this form has been the standard for so long. It actually dates back to 1844, when it first showed up in a work by Matthew O'Brien called A Treatise on Plane Co-ordinate Geometry. Before this, line equations were often written in ways that made it tough to see their key features. The y = mx + b structure made it incredibly simple to visualize and work with lines.
Why This Format Matters So Much
Getting comfortable with slope-intercept form is about more than just acing your next algebra test. It’s the bedrock for understanding linear relationships in the real world. This skill is absolutely essential when you need to https://feen.ai/blog/how-to-solve-word-problems-in-algebra, because it lets you turn a story or scenario into a clear mathematical picture.
The real power of y = mx + b is its directness. It instantly tells you the two most important things about a line: where it starts and where it's going.
For anyone who wants to take this understanding further into data analysis, these concepts are a must-know. An AP Statistics course builds heavily on the ability to interpret slopes and intercepts to make predictions from data.
To give you a clear path forward, I've put together a quick summary of the different methods we're about to walk through.
Your Roadmap to Finding Slope Intercept Form
This table breaks down the different starting points you might have and the basic game plan for each.
| If You Start With | What You Need to Do | Best For |
|---|---|---|
| A different equation format | Use algebra to isolate the 'y' variable on one side. | Quick conversions when you're already given an equation. |
| Two points (x₁, y₁) and (x₂, y₂) | First, calculate the slope (m). Then, use one point to solve for 'b'. | Situations where you only have a couple of data points. |
| A line on a graph | Identify the y-intercept (b) visually. Then, count the "rise over run" to find the slope (m). | When you have a visual representation of the line. |
Think of this as your cheat sheet. No matter what the problem looks like, one of these paths will get you to y = mx + b.
Getting Your Equation into Slope-Intercept Form
Let's be real—linear equations rarely show up neatly packaged in the y = mx + b format. You're far more likely to run into them in standard form or point-slope form. But don't worry. Converting them is just a bit of algebraic rearranging. The goal is always the same: get y all by itself on one side of the equals sign.
This isn't just about following rules for the sake of it. It’s a practical skill. For an estimated 85% of secondary math students, learning to convert an equation into slope-intercept form is a core part of their curriculum. Why? Because it makes graphing incredibly fast. Once you isolate y, you instantly know the slope and where the line hits the y-axis, which is a massive time-saver compared to plotting a bunch of individual points. You can discover more about these educational insights and their historical context.
Let’s walk through how to tackle the two most common formats you'll see.
From Standard Form to Slope-Intercept
Standard form is written as Ax + By = C, where A, B, and C are just numbers. A classic example is 2x + 4y = 8. Your whole mission here is to isolate y. Think of it as a simple puzzle where you use inverse operations to get y alone.
Here’s the game plan I always teach:
- Kick the x-term over: Your first move is to get the
Axterm away fromy. You do this by subtracting it from both sides of the equation. - Divide by y's sidekick: Now that
yis almost alone, just divide every single term in the equation byB(the number right next toy).
Let's work through 2x + 4y = 8 together.
First, we subtract 2x from both sides:2x - 2x + 4y = 8 - 2x
That tidies up to 4y = -2x + 8. I always suggest putting the x-term first to keep things organized for the final mx + b format.
Next, we divide everything by 4:4y/4 = -2x/4 + 8/4
After simplifying those fractions, you land on y = -1/2x + 2. And there you have it. The slope m is -1/2, and the y-intercept b is 2.
A common mistake I see all the time is students forgetting to divide every single term by the coefficient of y. They’ll divide the constant but completely miss the x-term, which throws off the slope. Always make sure you distribute that division across the entire other side.
From Point-Slope Form to Slope-Intercept
Point-slope form looks like y - y₁ = m(x - x₁). This format is great because it hands you the slope (m) on a silver platter. All that's left is a little algebraic cleanup to get y by itself.
The process is really just two steps:
- Distribute the slope: Multiply the slope
mthrough the parentheses(x - x₁). - Isolate y: Move the
y₁value to the other side of the equation.
Let’s try this with the equation y - 3 = 2(x - 1).
First, distribute the slope (2) into the parentheses:y - 3 = 2*x - 2*1
This gives us y - 3 = 2x - 2. We're almost there.
Now, just add 3 to both sides to get y alone:y - 3 + 3 = 2x - 2 + 3
This cleans up beautifully to y = 2x + 1. Done! The slope m is 2, and the y-intercept b is 1.
The main thing to watch out for with point-slope conversions is your signs, especially when you're dealing with negative slopes or coordinates. A misplaced negative is the quickest way to get the wrong answer, so always double-check your work.
How to Find the Equation Using Just Two Points
Sometimes, all you're given is a couple of data points. This happens all the time in the real world—maybe you're tracking a company's profit in two different years or measuring a plant's growth over a few weeks. With just those two coordinates, you have everything you need to build the full y = mx + b equation.
The whole process boils down to two main jobs: first, find the slope (m), and second, solve for the y-intercept (b). It’s a completely reliable method that works every single time.
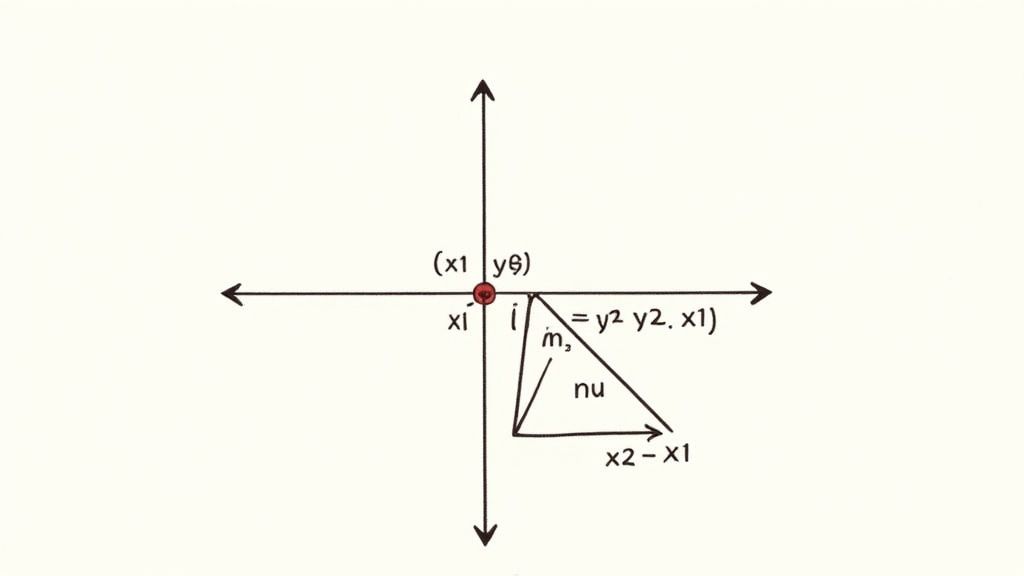
Master the Slope Formula
Your first move is always to calculate the slope. Remember, the slope is just the "rise over run"—how much the line goes up or down for every step it takes to the right. To calculate it precisely, we lean on the classic slope formula:
m = (y₂ - y₁) / (x₂ - x₁)
This might look a little intimidating, but all it's doing is comparing your two points, which we'll call (x₁, y₁) and (x₂, y₂). It genuinely doesn't matter which point you decide is the "first" one or the "second" one, as long as you keep your numbers consistent once you start plugging them in.
Here's a tip I always give my students: physically label your points before you start. If you have
(3, 7)and(5, 11), just writex₁=3andy₁=7right above the first point. This simple habit is the best way to avoid mixing up the numbers, which is easily the most common mistake I see.
The slope-intercept form has been a cornerstone of math education since about 1844 and now shows up in over 92% of international math textbooks. Its real power is in how it instantly reveals the slope and y-intercept, which makes graphing incredibly fast. This principle is used everywhere, from predicting economic trends in 80% of G20 nations to simple classroom exercises. You can explore more about the history of linear equations and how they're applied today.
Let's walk through an example. Say we have two points: (2, 5) and (4, 9).
- First, we'll label them:
x₁ = 2,y₁ = 5,x₂ = 4,y₂ = 9. - Now, we plug those values right into the formula:
m = (9 - 5) / (4 - 2) - Do the simple math:
m = 4 / 2, which gives us a slope of m = 2.
And just like that, we have the "m" for our equation.
Solve for the Y-Intercept
Now that we have the slope, our equation is halfway there: y = 2x + b. The only piece of the puzzle left is b, the y-intercept. To find it, we just need to borrow the coordinates from one of our original points and plug them into the equation we have so far.
You can use either point—you’ll get the exact same answer. Let's go with the first one, (2, 5), where x = 2 and y = 5.
- Substitute the values: We'll replace
ywith 5,mwith our calculated slope of 2, andxwith 2. Our equation becomes:5 = 2(2) + b. - Solve for b: Now, it's just a matter of simplifying and isolating our missing variable.
5 = 4 + b- Subtract 4 from both sides:
5 - 4 = b - This leaves us with
b = 1.
We've officially found our y-intercept.
Assemble the Final Equation
With both m and b figured out, we can finally write the complete slope-intercept equation. We found that m = 2 and b = 1.
Putting it all together, the final equation is:
y = 2x + 1
This single equation perfectly describes the line that runs through both (2, 5) and (4, 9). You started with just two dots on a graph and ended up with the full story of the line.
Finding the Equation Directly From a Graph
Sometimes, you don't have numbers or equations to work with, just a picture. Being able to look at a line on a graph and quickly pull its equation is a fantastic skill, especially when you're dealing with data charts or geometry. The whole process boils down to spotting two key features right on the graph.
For many people, this method just clicks. It feels more intuitive because you're counting spaces instead of crunching algebraic formulas. It’s a direct visual link between the line you see and the y = mx + b equation that defines it.
Spot the Y-Intercept First
The easiest part to grab is the y-intercept (b). This is simply the point where the line physically crosses the vertical y-axis. Just find that intersection point and read its y-value.
If the line hits the y-axis at the +3 mark, your b is 3. If it crosses way down at -5, then b is -5. Just like that, you've got the final piece of your equation solved.
Count the Rise Over Run for the Slope
Next up is the slope (m). Think of the slope as the line's "rise over run"—how much it goes up or down for every step it takes to the right.
To find it from the graph, here's what I do:
- Pick two clean points. Look for two spots where the line passes perfectly through the grid's crosshairs. Your y-intercept is usually a great starting point.
- Count the "rise." From the leftmost point, count how many units you have to travel up (positive) or down (negative) to get level with the second point. That’s your rise.
- Count the "run." Now, count how many units you move to the right to land on that second point. That's your run. When you move left to right, the run is always positive.
- Make the fraction. The slope,
m, is just your rise divided by your run.
Pro Tip: If the line is heading downhill as you look from left to right, your slope has to be negative. It's a quick mental check that has saved me from countless sign errors. If you count a "downward" rise as a negative number, the math will handle the sign for you.
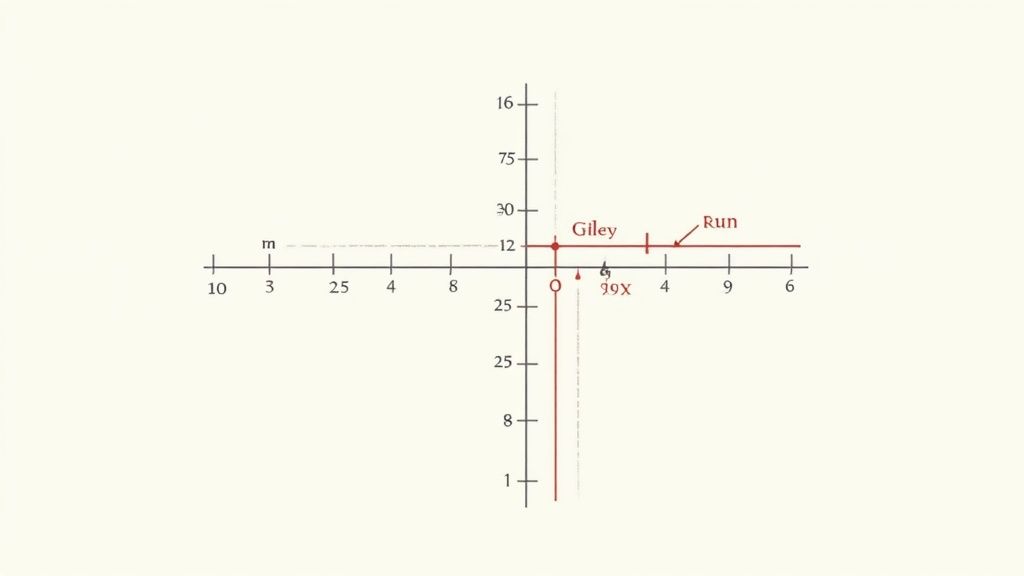
Let's walk through an example. Imagine a line that crosses the y-axis at (0, 1) and also goes through the point (3, 3).
- Our y-intercept (b) is right there at 1.
- To get the slope, we'll start at
(0, 1). We have to go up 2 units (the rise) and then run to the right 3 units (the run) to hit(3, 3). - This gives us a slope
mof 2/3.
Put it all together, and the equation for the line is y = (2/3)x + 1.
Getting comfortable with visualizing functions this way is a core math skill. If you want to dive deeper into how functions behave on a graph, our guide on how to find domain and range is a great next step.
Pro Tips and Common Mistakes to Avoid
Getting the basic steps down is one thing, but really mastering this stuff means knowing how to handle the curveballs and avoid the common traps. After working through thousands of these problems with students, I've seen where the same small mistakes pop up time and time again.
Let's talk about building good habits right from the start.
The single best habit you can develop is to always check your work. It's fast, simple, and it's the difference between thinking you have the right answer and knowing you do. Just take one of the original points you were given, like (4, 9), and plug the x and y values back into the final y = mx + b equation you came up with. If 9 = 2(4) + 1 works out, you can be confident you got it right.
Handling Special Cases and Sign Errors
Sooner or later, you're going to bump into horizontal and vertical lines. They don't quite follow the standard rules, and their simplified equations can throw you off if you're not ready for them.
- Horizontal Lines: These lines are perfectly flat, meaning they have a slope of zero. Their equation is just
y = c, wherecis whatever the y-coordinate is for every single point on that line. - Vertical Lines: These lines go straight up and down, so their slope is undefined. You can't write them in
y = mx + bform at all. Instead, their equation isx = c, wherecis the constant x-value.
Besides these special lines, the number one source of errors is simple sign mix-ups. It's so easy to make a mistake when you're subtracting a negative number in the slope formula, (y₂ - y₁) / (x₂ - x₁). A classic example is seeing something like 5 - (-2) and accidentally subtracting instead of adding.
My best piece of advice? Don't do sign changes in your head. Ever. Always write out the step, like turning
5 - (-2)into5 + 2. Taking that extra second to physically write it down will save you from so many careless errors, especially when distributing a negative slope.
A Quick Guide for Special Cases and Verification
To keep things straight, here’s a quick reference for those unusual lines and a reminder of how to verify any equation you find.
| Line Type | Key Feature | Equation Form | How to Verify |
|---|---|---|---|
| Horizontal | Slope is 0 | y = c |
Check if all original points have the same y-value. |
| Vertical | Slope is undefined | x = c |
Check if all original points have the same x-value. |
| Standard | Any non-zero slope | y = mx + b |
Plug an original point (x, y) into the final equation. |
The Verification Workflow
Building a reliable routine is what separates the pros from the novices. Your final step should always be that quick check. It's a methodical process that builds confidence.
Integrating verification into your workflow is a powerful strategy, and if you're looking to level up your general problem-solving, our guide on how to solve math problems step-by-step has even more tips. Making this a non-negotiable step turns guesswork into certainty.
Got Questions? We've Got Answers
Even when you've got the methods down, a few tricky scenarios always seem to pop up. Let's tackle some of the most common questions to make sure you're ready for anything.
Think of these as the edge cases that really test your understanding of how linear equations work.
What Happens If a Line Passes Through the Origin?
This is a great question, and the answer is simpler than you might think. If a line runs directly through the origin, which is the point (0, 0), its y-intercept (b) is just 0.
That simplifies the slope-intercept form all the way down to y = mx. When you plug in the point (0, 0) to solve for b, you'll see it comes out to zero every time. An equation like y = 4x tells you the line has a slope of 4 and starts right at the center of the graph.
A line passing through the origin shows a direct proportional relationship. This means y is always a constant multiple of x, and that constant multiplier is your slope.
Can I Find Slope-Intercept Form for a Vertical Line?
You can't, and there's a good reason why. A vertical line has an undefined slope. Since y = mx + b requires a value for m, you simply can't write a vertical line's equation in this format.
The "m" doesn't exist because the "run" (the change in x) is zero, and we all know you can't divide by zero. So what do you do? A vertical line gets a much simpler equation: x = c. Here, 'c' is just the constant x-value for every single point on the line. For example, a vertical line crossing the x-axis at (5, 0) has the equation x = 5.
Why Is This Form So Important to Learn?
Honestly, y = mx + b is a cornerstone of algebra because it’s so revealing. With just a quick glance, you get two of the most critical facts about a line: its steepness (m) and where it crosses the y-axis (b).
This makes graphing incredibly fast—no more plotting a bunch of points to see the pattern. And this isn't just a classroom concept. It's a foundational tool used everywhere, from science and economics to data analysis, for modeling any kind of linear relationship, like predicting sales growth or analyzing results from an experiment.
Is Point-Slope or Slope-Intercept Better?
Neither one is really "better"—they're just different tools for different jobs. It all depends on what information you have to start with.
- Point-Slope Form:
y - y₁ = m(x - x₁)is your go-to when you have the slope and any point that isn't the y-intercept. It's often the quickest way to get an equation down on paper. - Slope-Intercept Form:
y = mx + bis the champion of interpretation and graphing. It’s usually the format you want to end up with.
A common workflow is to use the info you're given to start with point-slope form, then just use a little algebra to rearrange it into the final slope-intercept form.
Struggling with a tricky math problem or need to check your work? Feen AI is an AI-powered homework helper that gives you clear, step-by-step explanations for Math, Chemistry, Physics, and more. Just upload a picture of your problem and get the help you need to understand the concepts, not just the answers. Try it out at https://feen.ai.